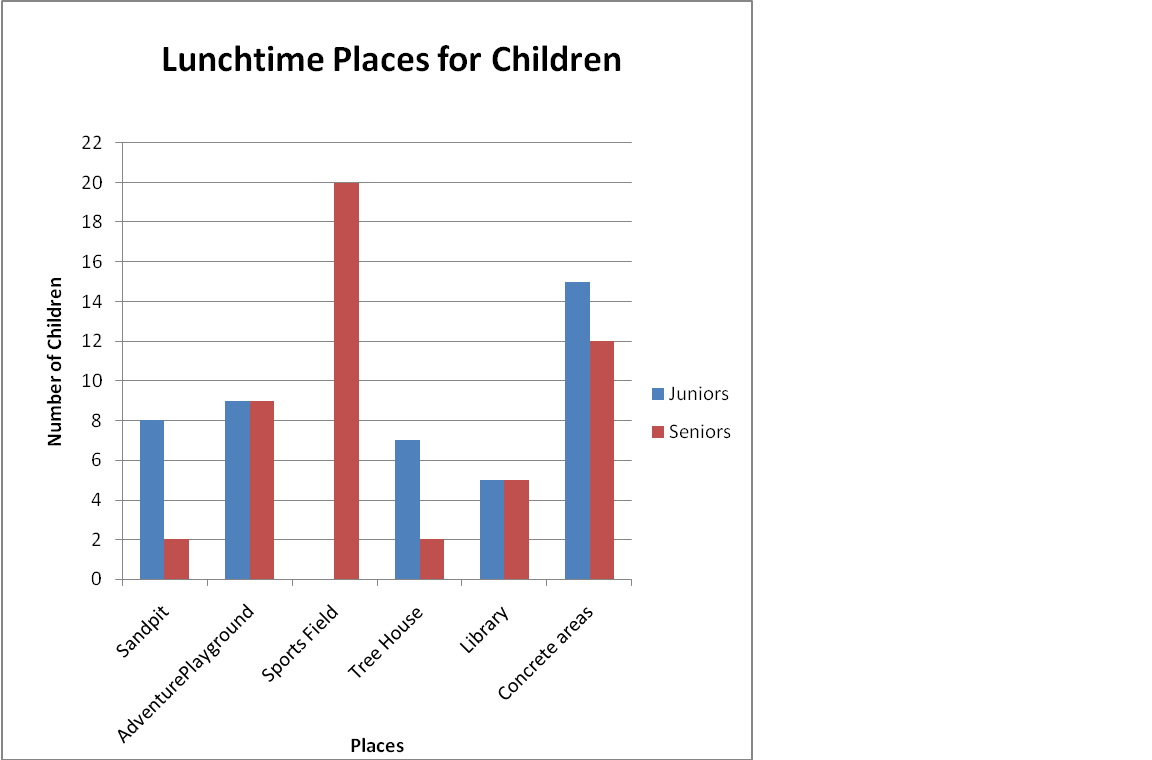
“The teachers at Sunshine school wanted to know where the most
children play at lunchtime. After one lunchtime they asked all the
children where they had spent most of the lunchtime and made
a bar graph.
children play at lunchtime. After one lunchtime they asked all the
children where they had spent most of the lunchtime and made
a bar graph.
After analysing the data, there were 94 students who were involved in the
survey.
I analysed how many Juniors and Seniors had been involved.
The amount of Juniors and Seniors where that there was 50 seniors/ 44 Juniors.
The most popular place for the Juniors were the concrete areas.
The most popular place for the Seniors were sports field.
survey.
I analysed how many Juniors and Seniors had been involved.
The amount of Juniors and Seniors where that there was 50 seniors/ 44 Juniors.
The most popular place for the Juniors were the concrete areas.
The most popular place for the Seniors were sports field.
W.A.L.T Analyse and discuss data displays.
No comments:
Post a Comment